The Logger | Plot Options… menu command allows you to set the graphical parameters of all the variables selected to be plotted in any of the four subplots of Logger View, as colors, line width and pattern, background, axes colors, grid options and measurement units.
The list of variables that will be stored during the data logging must be defined using the Logger | Variables… menu command. Once this list defined, you may use the Logger | Plot Setup dialog in order to select the corresponding variables and distribute them on the graphics subplots for further visualization.
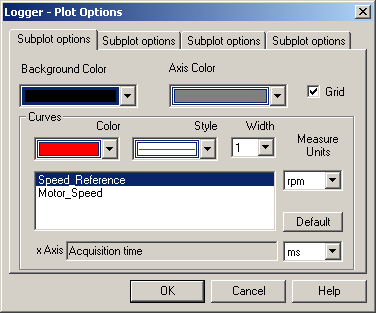
With the plot variables selected in the Logger | Plot Setup dialog, you may open the Logger Plot Options dialog in order to examine / modify the predefined graphic attributes associated to the curves, axes, etc.
The dialog contains the complete list of the variables selected to be stored for each of the possible four subplots that may be defined. For each subplot, any variable to be plotted on it may be selected from the list grouped under the title Curves.
You may switch between the subplots using the corresponding tabs associated to each subplot. By default, each subplot tab is named as Subplot options if no name was given to the curve. Otherwise, if that name was defined, it is used as the tab name. (You may freely define each of the subplot names in the Logger | Plot Setup dialog).
For each subplot, you may select any of the variables from the Curves list. Once a variable is selected (outlined) in the list, its graphical attributes are displayed and may be examined and/or modified by you.
Thus, you may modify:
| • | The curve color, using the Color drop-down list of available colors (up to 28 colors may be used); |
| • | The curve style, using the Style drop-down list of available line styles (up to 5 line styles may be used); |
| • | The curve width, using the Width drop-down list of available line widths (1 to 4 line widths may be used) |
You can change in the Measure Units drop-down list the units in which to display the variables stored.
The background color may be defined for each subplot, using the Background Color drop-down list (up to 28 colors may be used).
The axis color may be defined for each subplot, using the Axis Color drop-down list (up to 28 colors may be used).
The grid option for each subplot may be set/reset using the Grid check button.
You may also define the X-axis label and measurement unit, by editing the X-Axis edit control field and respectively, by selecting the measurement unit from the associated drop-down list of possible units.
Use the Default button to reset all the selected measurement units for the curves.
Use the OK button to effectively apply the defined settings and exit back to the Logger View, by closing the Logger - Plot Options dialog.
Use the Cancel button to cancel all the defined settings and exit back to the Logger View, by closing the Logger - Plot Options dialog.
See also: