The Logger | Plot Setup… menu command allows you to select and group on specific graphic subplots the variables which will be stored during the motion execution through the data logging procedure. Up to four subplots may be defined.
The list of variables, which will be stored during the data logging, must be defined using the Logger | Variables… menu command. Once this list defined, you may accede the Logger - Plot Setup dialog in order to select the corresponding variables and distribute them on the graphics subplots for visualization.
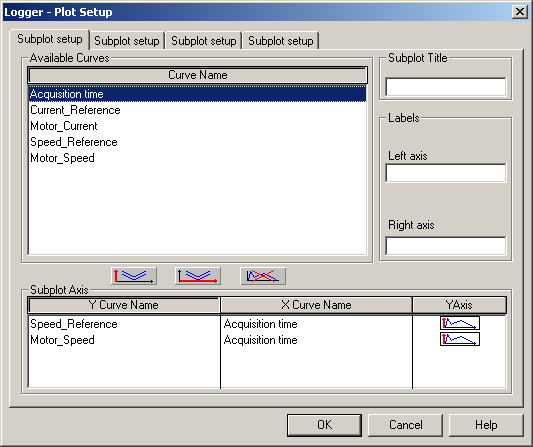
The dialog contains the complete list of the curves selected to be stored, in the top of it. For each subplot, the curves to be plotted on it may be chosen from the complete list of stored variables, grouped under the title Available Curves.
You may switch between the subplots using the corresponding tabs associated to each subplot. By default, each subplot tab is named as Subplot setup. You may freely define each of the subplot names. The Subplot Title edit box contains the actual (if it was defined) subplot title. You may define or modify it at any time by editing this edit control.
Each subplot has an associated list of the selected curves to be displayed on that subplot, grouped under the name of Subplot Axis. The list may be updated by you by adding to / removing from it curves from the Available Curves list.
A variable may be added to the subplot curves list by selecting it in the Available Curves list, with a left-button mouse click (the selected variable becomes outlined), and by pressing on one of the Add to the list buttons: press ![]() to add it as the Y axis curve, or press the
to add it as the Y axis curve, or press the ![]() button to add it as the X axis curve.
button to add it as the X axis curve.
When adding a new variable to the subplot curves list, by having at the same time a selected (outlined) curve in the Subplot Axis list, the added variable will automatically replace the previous one from the Subplot Axis list, corresponding to the Y or X axis selected to be replaced.
A curve may be removed from the subplot curves list by selecting it in the Subplot Axis list, with a right-button mouse click (the selected curve becomes outlined), and by pressing the Remove from the list button ![]() .
.
Always, the variable Acquisition Time exists in the Available Curves list. Usually, you will select some other variable to be added to the Subplot Axis list. When the first variable is selected and added to that list as a Y axis curve, the program automatically inserts by default, as the X-axis, the Acquisition Time variable ![]() .
.
The variables may be related to the left or to the right vertical axis of the subplot. Usually, the variables are introduced as related to the left vertical axis ![]() . If you want to change this setting to the right vertical axis, you need to double-click the vertical axis symbol, which will commute to the right vertical axis symbol
. If you want to change this setting to the right vertical axis, you need to double-click the vertical axis symbol, which will commute to the right vertical axis symbol ![]() . (A similar double-click on this symbol will reverse again the vertical axis to the left one).
. (A similar double-click on this symbol will reverse again the vertical axis to the left one).
If you want to use a special X-axis coordinate, different that the time variable (in order to visualize the dependence between two variables), you must select the desired X-axis variable in the Available Curves list, and add it to the Subplot Axis list using the Add to X axis button ![]() . The newly selected variable will replace the time variable as the X-axis coordinate.
. The newly selected variable will replace the time variable as the X-axis coordinate.
By default, the vertical axes do not have a name. You may freely define for each of the subplots names for the two vertical axes. The Labels group contains the actual (if it was defined) subplot Left axis and Right axis names. You may define or modify them at any time by editing the corresponding edit control.
Use the OK button to effectively apply the defined settings and exit back to the Logger View, by closing the Logger - Plot Setup dialog.
Use the Cancel button to cancel all the defined settings and exit back to the Logger View, by closing the Logger - Plot Setup dialog.
See also: