- Introduction
The logger is one of the graphical tools available in EasyMotion Studio II, its main function is recording the data points of any variable of the drive with the best possible precision.
- Why would I need to use the Logger?
Technosoft drives have two main control loops: The Fast loop and the Slow loop. The Fast loop has the default sampling period of 0.1ms and its main task is reading the motor currents and sensors, calculating the next voltage reference and applying it. The Slow loop has the default sampling period of 1ms (which can be reduced down to 0.2ms), its main task being the generation of the trajectory for the motor as well as doing the actual speed and position control.
The Logger has a maximum number of points that it can record, which differs between Technosoft drives depending on the available RAM. However, the Logger is especially useful when the data needs to be analyzed at a high precision. This is because it can record data at every Fast loop, Slow loop or a multiple of them. Due to this, data can be analyzed at a sampling precision as small as 0.1ms.
Another advantage of reading the data at the Control loops is that, in regards to the values read, all of them are recorded in the same time – unlike the other monitoring tools (control panel / command interpreter) which can’t ensure such synchronization.
- How does the logger work?
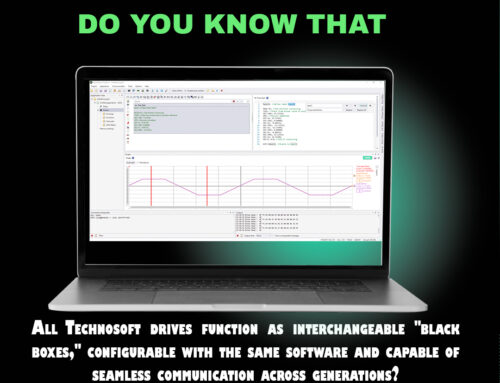
The logger can be accessed from the top tab of EasyMotion Studio II or by pressing the Ctrl + L key combination on the keyboard.
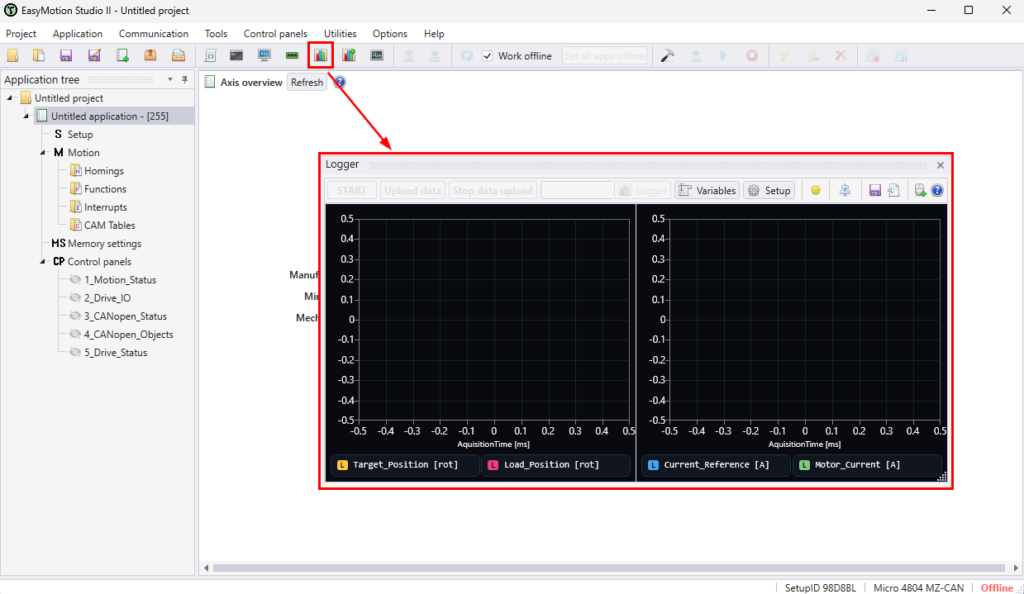
By default, the Target_Position, Load_Position, Current_Reference and Motor_Current parameters are set. Therefore, the user has the possibility to see precisely the evolution of the motor position vs the position reference. The presence on the other plot of the current waveforms can further help – if the case – understand the reason for the big position error – is the drive running into a limit or the PI / PID gains are simply not high enough?
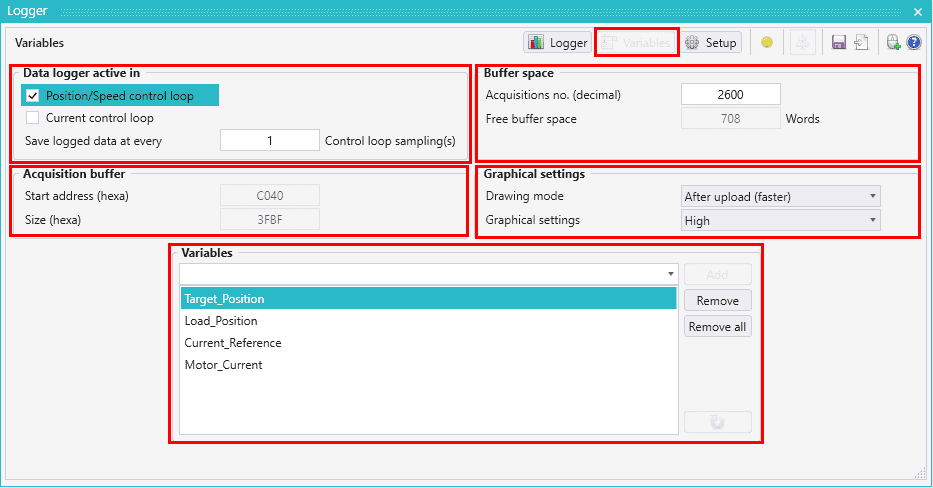
In the Variables section, the following settings are found:
The “Data Logger active in” section, allows our users to set the base sampling for logging the data: the Position/Speed control loop (Slow loop) or the Current control loop (Fast loop) and finally the multiplier for them which can range from 1 to n periods of the selected control loop.
The “Acquisition buffer” section provides information such as the starting address of the logger and its size in hexadecimal. The size in the case for a Micro4804 drive is 3FBFh, with a small section used for some internal logger operations (starting/stopping the logger, defining the starting address, addresses of variables to be logged), therefore leaving the total usable space for data logging at 3FB4h = 16308 Words (for the default configuration).
The “Buffer space” section, provides information such as the number of acquisitions points, and how much space is left free in the buffer. To get the maximum amount of points logged, it is enough to set a high value (i.e. 99999) in the “Acquisitions no.” field and EasyMotion Studio II will apply the maximum value depending on the number of variables that are going to be recorded, their size (16-bit or 32-bit) and the total size of the buffer itself.
In the “Variables” section is where new variables can be added or removing the ones that are not needed. There is no limit to the number of variables that can be logged; however, it is important to keep in mind that the acquisition buffer is spread equally between all the selected variables.
Example:
Having in mind the variables in the above picture, Target_Position and Load_Position are 32-bit variables while Current_Reference and Motor_Current are 16-bit and the 16308 Words available in the buffer, it will mean that the maximum available points per variable is 2718 (i.e. 2*2718 Words per 32-bit variable and 2718 Words per 16-bit variable).
If the sampling is done in the Slow loop (1ms), this will result in a total logging time of 2718*1ms = 2.718 seconds. For maximum precision, it can be set to the Fast loop (0.1ms), however the total logging time will be reduced to 271.8ms.
Remark: one can remove the unnecessary variables to free up buffer space, to increase the total logged time (while maintaining the same precision)
- How to use the logger?
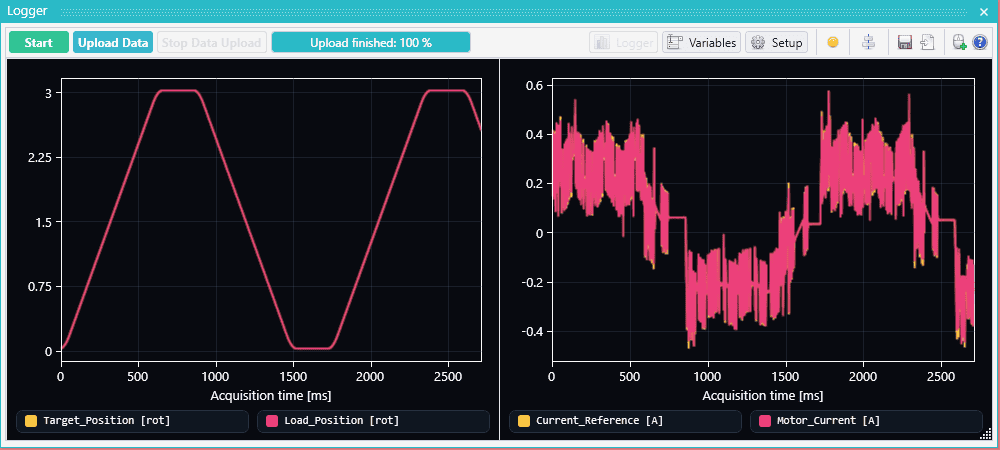
By default, upon Running an EasyMotion Studio II application, the logger will automatically save the data only once along with the start of the TML program, so users will only need to press the “Upload data” button if they require to see the behavior from the moment the program starts.
However, if the behavior that needs to be observed is somewhere later in the program, then the “Start” button must be pressed first, right before the behavior happens, upon which the data acquisition will start from that moment on (the previous recording is lost). Then, press the “Upload data” button to plot the said data. Once the upload is finished, the data can be analyzed:
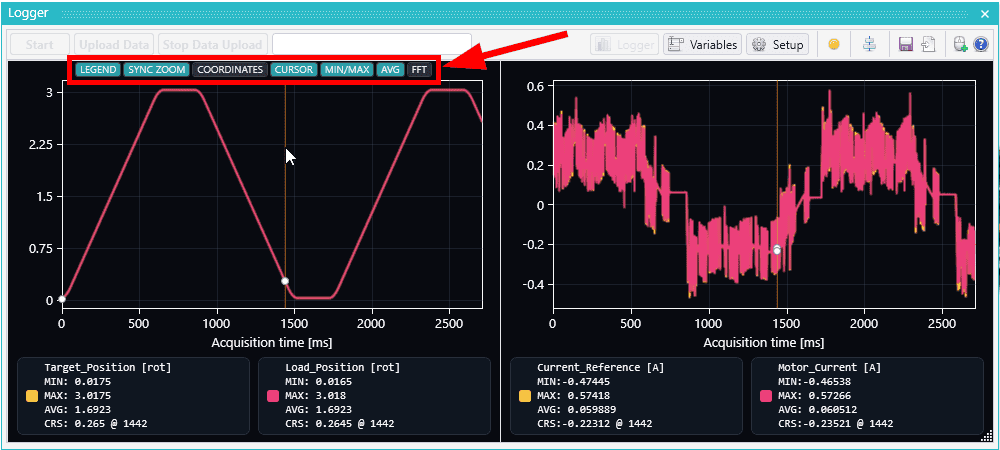
For a better analysis of the data, users can do the following:
- Zoom in on specific points for a more detailed view, by using the mouse scroll wheel. If there are multiple subplots, the same zoom will be applied on all subplots.
- Cursor: When enabling the cursor, the data at the time moment pointed by the cursor will be displayed in the Legend under the CRS name.
- Min/Max: Once enabled, the minimum and maximum values (of the logged graph) will be displayed in the legend, for all the variables.
- Average: Compute the average value, also displayed in the legend.
- FFT: Display an Fast Fourier Transform graph of the logged values.
The abovementioned can be found and enabled at the top of any subplot:
In the “Setup” section of the Logger, users can allocate the declared variables in any of the 9 available subplots. There is no restriction to how many subplots a variable can be allocated to. In this section, users can define if the Y axis of the variable is on the left or on the right side, what measurement units it will be displayed in, as well as changing the color, the style of the line and the thickness:
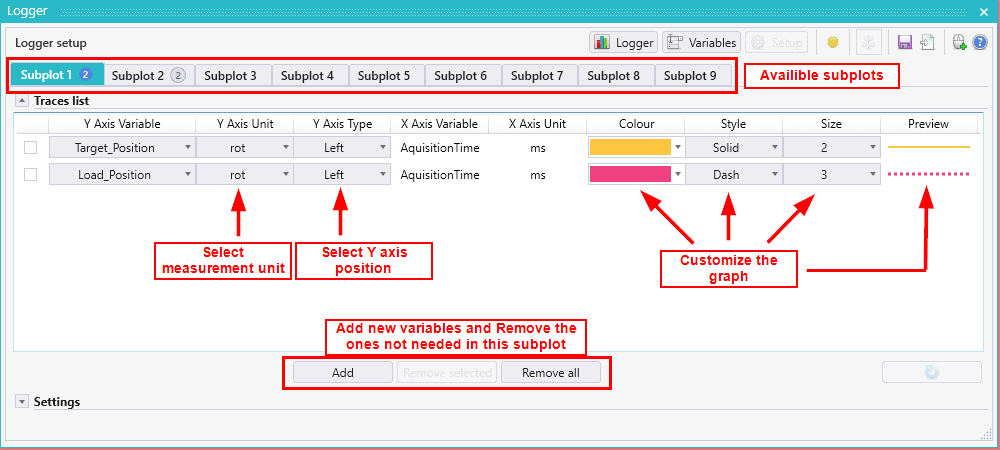
Remarks:
- only variables already defined in the “Variables” section can be added in the subplots
- removing a variable from a sublot does not remove it completely from the logger (i.e. it will still be logged but not displayed). To completely remove a variable (and free up buffer space) it must be done in the “Variables” section.
- Why a black box?
The similarity to a plane’s black box comes from the fact that the set of points can be exported once an upload has finished. The data is exported by default as *.lgs2 format for EasyMotion Studio II, but it can also be exported as *.txt, *.png or *.csv:
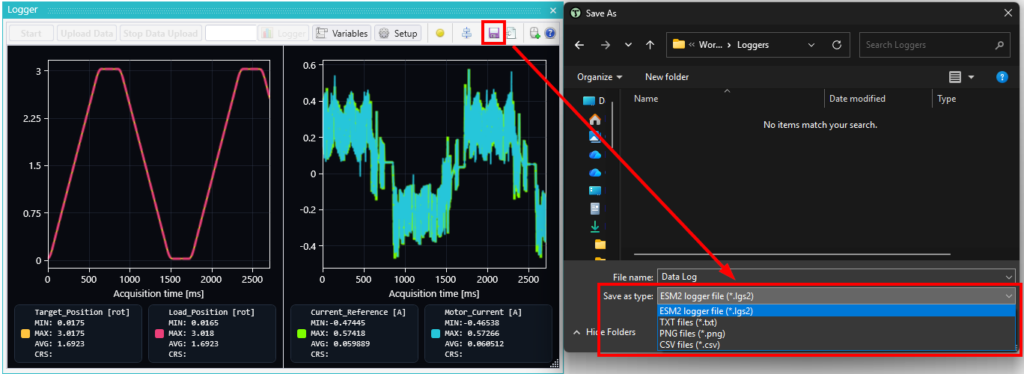
This way, users can save the points on their PC for later analysis and import them in their preferred application, such as Excel.
- Conclusions
The Logger is the most precise visualization tool available in EasyMotion Studio II, it offers high precision of the data acquisition, enabling the user to observe and analyze the data at the sample rate that the drive is working on while at the same time being very flexible due to the possibility of exporting the data for later uses.
Contact our team today!


